Kinematic Self-Replicating Machines
© 2004 Robert A. Freitas Jr. and Ralph C. Merkle. All Rights Reserved.
Robert A. Freitas Jr., Ralph C. Merkle, Kinematic Self-Replicating Machines, Landes Bioscience, Georgetown, TX, 2004.
Appendix A. Data for Replication Time and Replicator Mass
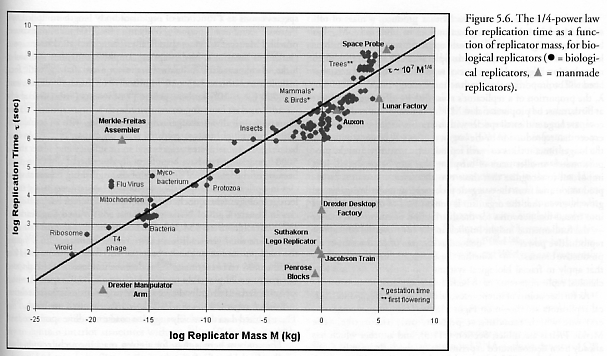
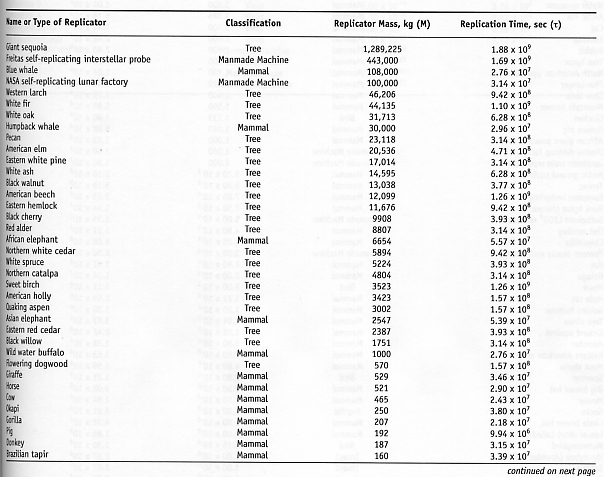
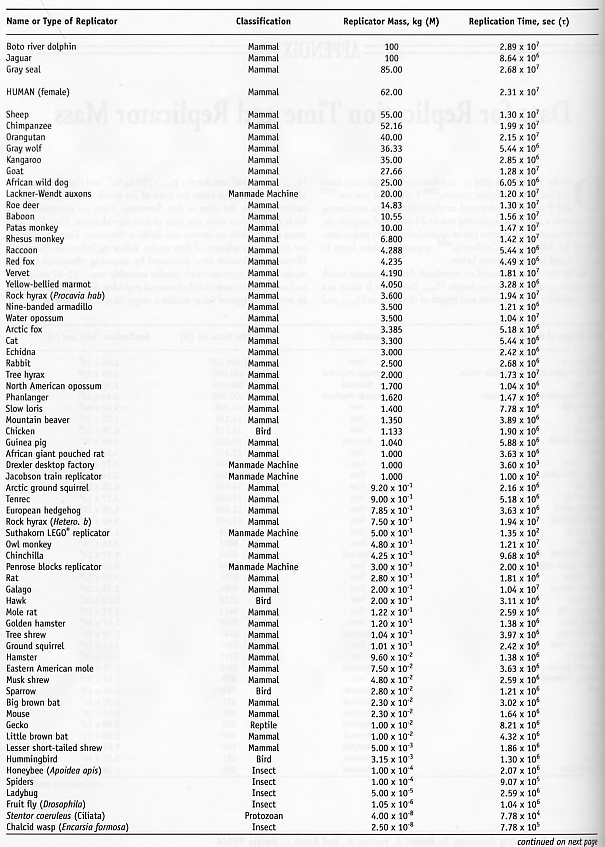
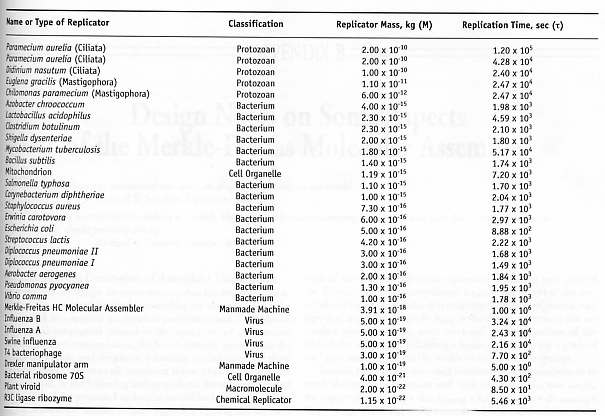
Data for replication time (t) as a function of replicator mass (M) for 126 biological species [2600], 1 chemical species [1372], and 9 actual or proposed artificial kinematic replicating systems across a size range spanning nearly 20 orders of magnitude, drawn from numerous sources (most appreciatively the major contribution by Allison and Cicchetti [2600]), appears in chart form in Figure 5.6 and in tabular form below.
Data for tree mass are based on tabulated data for mature trunk diameter Dtrunk and mature tree height Htree. Tree trunk is taken as a uniform cylinder with diameter and length of dimensions Dtrunk and Htree, with overall tree density rtree ~700 kg/m3, and the total mass M of the tree is taken as twice the mass of the trunk. Data for tree replication time are the time to first flowering. Data for mammals and birds are gestation time, not time to first reproduction. Data for protozoa and bacteria are inverse cell division frequency. Data for viruses are time to completion of first replica following infection. Bacterial ribosome replication time estimated by assuming ribosomal nucleotides have an approximately similar assembly rate (~15-40 residues/sec) as ribosome-assembled ribosomal peptides. Some data represent an average or typical value within a range (that is not shown).
Last updated on 13 August 2005